simplelife cashflow
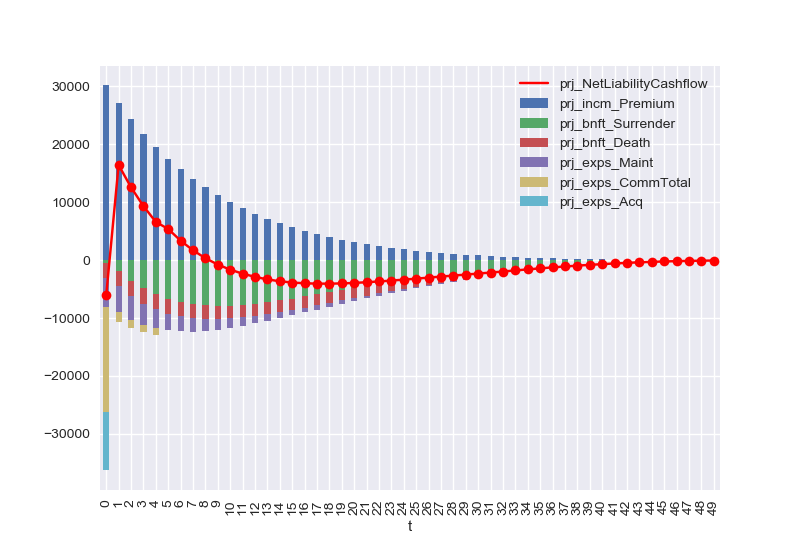
Draw a graph of liability cashflows of a simple whole life policy
Out:
Started loading data from 'input.xlsm'.
...Loaded PolicyData (5.48secs)
...Loaded MortalityTables (2.41secs)
...Loaded ProductSpec (1.99secs)
...Loaded OtherParam1 (1.92secs)
...Loaded OtherParams2 (1.99secs)
...Loaded Assumptions (1.97secs)
...Loaded AssumptionTables (1.95secs)
...Loaded Scenarios (2.22secs)
Input space and its sub spaces are saved in 'lifelib.mx'.
You can load input data from the saved file instead of 'input.xlsx'
by passing 'load_saved=True' to simplelife.build function.
try:
    import simplelife.simplelife as simplelife
except ImportError:
    import simplelife

proj = simplelife.build().Projection

vars = ['prj_incm_Premium',
        'prj_bnft_Surrender',
        'prj_bnft_Death',
        'prj_exps_Maint',
        'prj_exps_CommTotal',
        'prj_exps_Acq']

polid = 171

for cells in vars:
    list(proj[polid].cells[cells](t) for t in range(50))

cfs = proj[polid].frame[vars].sort_index().dropna()
cfs[vars[1:]] = cfs[vars[1:]].mul(-1)

[proj[polid].prj_NetLiabilityCashflow[t] for t in range(50)]

ncf = proj[polid].prj_NetLiabilityCashflow.frame.sort_index()

import seaborn as sns
sns.set()

axes = ncf.plot.line(marker='o', color='r')
cfs.plot(kind='bar', stacked=True, ax=axes)
Total running time of the script: ( 0 minutes 22.469 seconds)