nestedlife cashflow
Draw a graph of present value of cashflow
Out:
Started loading data from 'input.xlsm'.
...Loaded PolicyData (5.04secs)
...Loaded MortalityTables (2.40secs)
...Loaded ProductSpec (1.97secs)
...Loaded OtherParam1 (2.05secs)
...Loaded OtherParams2 (1.95secs)
...Loaded Assumptions (2.18secs)
...Loaded AssumptionTables (2.09secs)
...Loaded Scenarios (2.31secs)
Input space and its sub spaces are saved in 'lifelib.mx'.
You can load input data from the saved file instead of 'input.xlsx'
by passing 'load_saved=True' to simplelife.build function.
try:
import nestedlife.nestedlife as nestedlife
except ImportError:
import nestedlife
polid = 171
model = nestedlife.build(load_saved=False)
outer = model.OuterProjection
inner = model.OuterProjection.InnerProjection
#%% Code block for overwiting the defaut model
def nop_Surrender_outer(t):
"""Number of policies: Surrender"""
if t == 1:
surr_rate_mult = 2
elif t == 2:
surr_rate_mult = 0.5
else:
surr_rate_mult = 1
return nop_BoP1(t) * asmp.SurrRate(t) * surr_rate_mult
def nop_EoP_inner(t):
"""Number of policies: End of period"""
if t == t0:
return outer.nop_EoP(t)
else:
return nop_BoP1(t - 1) - nop_Death(t - 1) - nop_Surrender(t - 1)
outer.new_cells(name='nop_Surrender', formula=nop_Surrender_outer)
outer[polid].InnerProjection[1].SurrRateMult = 2
outer[polid].InnerProjection[2].SurrRateMult = 0.5
inner.new_cells(name='nop_EoP', formula=nop_EoP_inner)
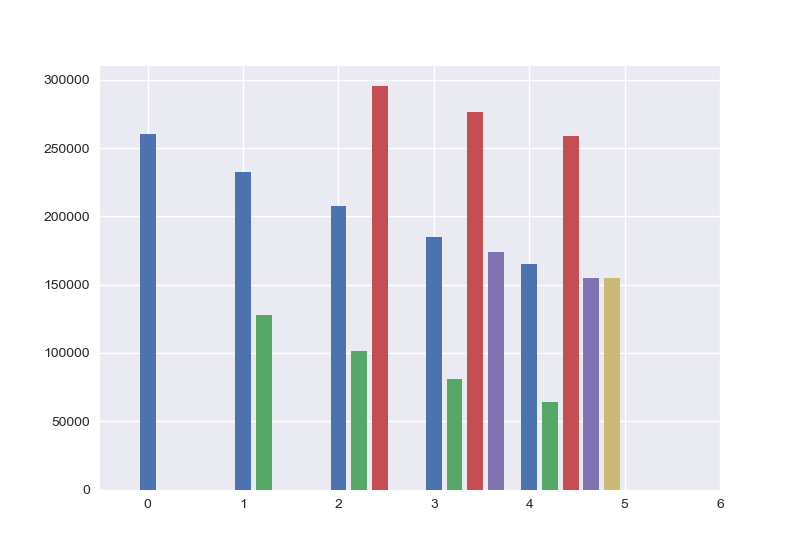
#%% Code block for PV graph
import numpy as np
import matplotlib.pyplot as plt
import seaborn as sns
sns.set()
def draw_bars(item):
term = 5
expect = []
for t0 in range(term):
expect_t0 = [np.nan] * term
for t in range(t0, term):
cells = outer[polid].InnerProjection[t0].cells[item]
expect_t0[t] = cells[t]
expect.append(expect_t0)
fg, ax = plt.subplots()
ax.set_xlim(left=-0.5, right=term + 1)
for t0 in range(term):
draw_single_bar(expect[t0], ax, t0)
def draw_single_bar(data, ax, t0):
size = len(data)
width = 1/ (size + 1)
ax.bar(np.arange(size) + t0 * (width + 0.05), data, width)
#%% PV Test
if __name__ == '__main__':
draw_bars('pv_incm_Premium')
Total running time of the script: ( 0 minutes 21.545 seconds)