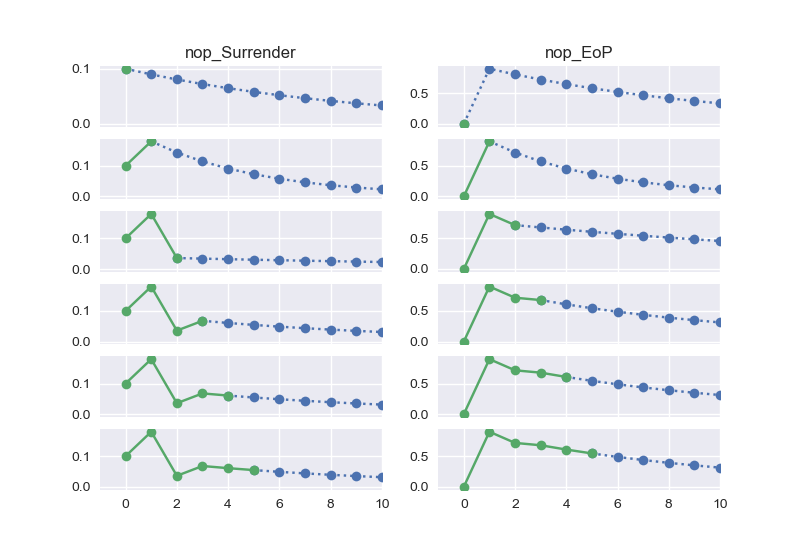
Actual vs expected
Lapse assumption changes based on previous year experience.
Out:
Started loading data from 'input.xlsm'.
...Loaded PolicyData (5.33secs)
...Loaded MortalityTables (2.37secs)
...Loaded ProductSpec (2.22secs)
...Loaded OtherParam1 (1.96secs)
...Loaded OtherParams2 (2.01secs)
...Loaded Assumptions (2.02secs)
...Loaded AssumptionTables (1.94secs)
...Loaded Scenarios (2.34secs)
Input space and its sub spaces are saved in 'lifelib.mx'.
You can load input data from the saved file instead of 'input.xlsx'
by passing 'load_saved=True' to simplelife.build function.
try:
    import nestedlife.nestedlife as nestedlife
except ImportError:
    import nestedlife


polid = 171
model = nestedlife.build(load_saved=False)
outer = model.OuterProjection
inner = model.OuterProjection.InnerProjection

#%% Code block for overwiting the default model

def nop_Surrender_outer(t):
    """Number of policies: Surrender"""

    if t == 1:
        surr_rate_mult = 2
    elif t == 2:
        surr_rate_mult = 0.5
    else:
        surr_rate_mult = 1

    return nop_BoP1(t) * asmp.SurrRate(t) * surr_rate_mult


def nop_EoP_inner(t):
    """Number of policies: End of period"""
    if t == t0:
        return outer.nop_EoP(t)
    else:
        return nop_BoP1(t - 1) - nop_Death(t - 1) - nop_Surrender(t - 1)


outer.new_cells(name='nop_Surrender', formula=nop_Surrender_outer)
outer[polid].InnerProjection[1].SurrRateMult = 2
outer[polid].InnerProjection[2].SurrRateMult = 0.5
inner.new_cells(name='nop_EoP', formula=nop_EoP_inner)

#%% Code block for drawing graphs

import numpy as np
import matplotlib.pyplot as plt
import seaborn as sns
sns.set()

def get_nested(item):

    cells = outer[polid].cells[item]

    act = [cells[t] for t in range(50)]
    expect = []

    for t0 in range(0, 6):
        expect_t0 = [np.nan] * 50
        for t in range(0, 50):
            if t < t0:
                expect_t0[t] = np.nan
            else:
                cells = outer[polid].InnerProjection[t0].cells[item]
                expect_t0[t] = cells[t]

        expect.append(expect_t0)

    return act, expect


def mask_act(act, t0):
    masked_act = act.copy()
    for t, val in enumerate(masked_act):
        if t > t0:
            masked_act[t] = np.nan
    return masked_act


def draw_single_ncf(ncf, ax, ls):
    ax.plot(ncf, marker='o', linestyle=ls)
    ax.set_xlim(right=10, left=-1)


def draw_graph_column(item):

    act, expect = get_nested(item)

    nrows = len(expect)
    fg, axs = plt.subplots(nrows=nrows, sharex=True, sharey=True)
    for t0, ax in enumerate(axs):
        draw_single_ncf(expect[t0], ax, ':')
        draw_single_ncf(mask_act(act, t0), ax, '-')


def draw_graph_pair(*items):

    ncols = len(items)
    pairs = [get_nested(item) for item in items]
    nrows = len(pairs[0][1])

    fg, axs = plt.subplots(nrows=nrows, ncols=ncols, sharex=True)

    for col in range(ncols):
        axs[0][col].set_title(items[col])
        for t0 in range(nrows):
            ax = axs[t0][col]
            act, expect = pairs[col]
            draw_single_ncf(expect[t0], ax, ':')
            draw_single_ncf(mask_act(act, t0), ax, '-')


if __name__ == '__main__':
    draw_graph_pair('nop_Surrender', 'nop_EoP')
Total running time of the script: ( 0 minutes 21.754 seconds)