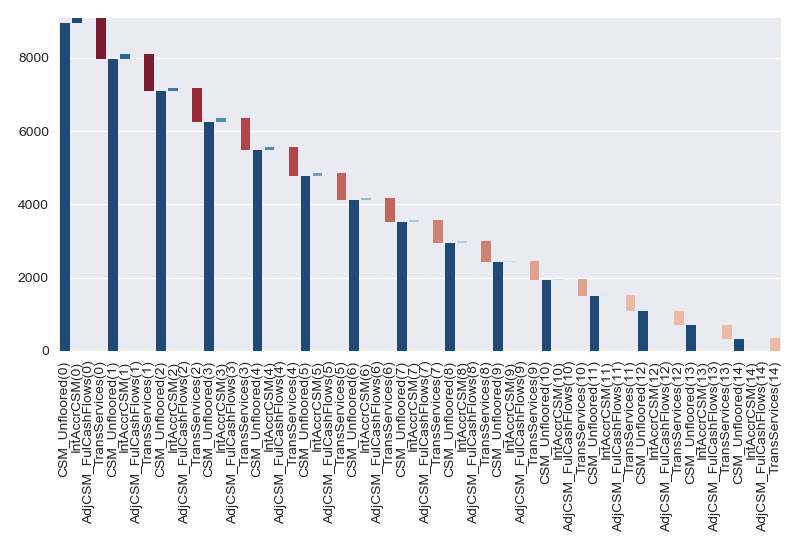
ifrs17sim CSM waterfall chart
Draw a graph of CSM amortization pattern.
Run this sample now! ![]()
import pandas as pd
import collections
from draw_charts import draw_waterfall

try:
    import ifrs17sim.ifrs17sim as ifrs17sim
except ImportError:
    import ifrs17sim

model = ifrs17sim.build()
proj = model.OuterProjection[1]

proj.CSM_Unfloored(15)
data = collections.OrderedDict()

for cells in ['CSM_Unfloored',
              'IntAccrCSM',
              'AdjCSM_FulCashFlows',
              'TransServices']:
    data[cells] = [proj.cells[cells](t) for t in range(15)]

df = pd.DataFrame(data)
df['TransServices'] = -1 * df['TransServices']

draw_waterfall(df)
Total running time of the script: ( 0 minutes 28.646 seconds)