ifrs17sim CSM pattern
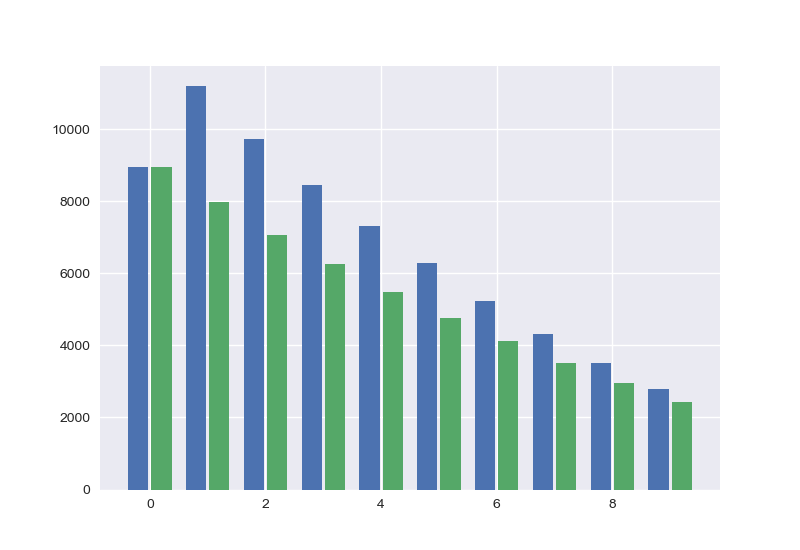
Draw a graph of CSM amortization pattern.
import modelx as mx

try:
    import ifrs17sim.ifrs17sim as ifrs17sim
except ImportError:
    import ifrs17sim


def draw_bars(proj):
    liab = [proj.InnerProjection[t].pv_NetLiabilityCashflow[t] for t in range(10)]

    proj.CSM_Unfloored(15)
    data = [proj.CSM_Unfloored(i) for i in range(10)]
    fg, ax = plt.subplots()

    draw_single_bar(liab, ax, -1)
    draw_single_bar(data, ax, +1)


def draw_single_bar(data, ax, n):
    width = 0.4
    ax.bar(np.arange(len(data))  + n * (width/2), data, width - 0.05)

if __name__ == '__main__':
    import numpy as np
    import matplotlib.pyplot as plt
    import seaborn as sns
    sns.set()

    model = ifrs17sim.build()
    proj = model.OuterProjection[1]
    draw_bars(proj)
Total running time of the script: ( 0 minutes 22.356 seconds)