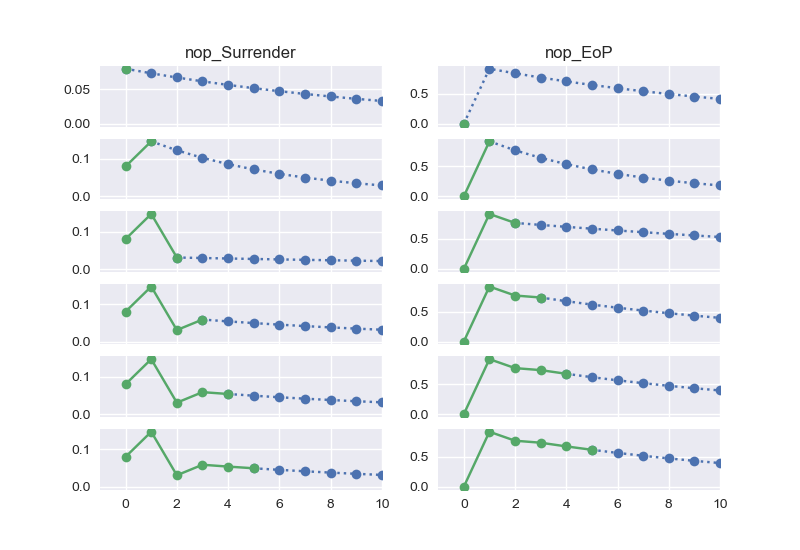
Actual vs expected
Lapse assumption changes based on previous year experience.
import modelx as mx

try:
    import nestedlife.nestedlife as nestedlife
except ImportError:
    import nestedlife

model = nestedlife.build()

# Policy point ID and aliases
polid = 171
outer = model.OuterProjection[polid]
inner = outer.InnerProjection

# %% Code block for overriding the default model

def SurrRateMult(t):
    if t == 0:
        return 1
    else:
        return SurrRateMult(t - 1)


def nop_Surrender(t):
    """Number of policies: Surrender"""
    return nop_BoP1(t) * asmp.SurrRate(t) * SurrRateMult(t)


def nop_EoP_inner(t):
    """Number of policies: End of period"""
    if t == t0:
        return outer.nop_EoP(t)
    else:
        return nop_BoP1(t - 1) - nop_Death(t - 1) - nop_Surrender(t - 1)


model.BaseProjection.new_cells(formula=SurrRateMult)
model.BaseProjection.new_cells(formula=nop_Surrender)
inner.new_cells(name='nop_EoP', formula=nop_EoP_inner)

outer.SurrRateMult[1] = 2
outer.SurrRateMult[2] = 0.5
outer.SurrRateMult[3] = 1

inner[1].SurrRateMult[1] = 2
inner[2].SurrRateMult[2] = 0.5
inner[3].SurrRateMult[3] = 1

# %% Code block for drawing graphs

import numpy as np
import matplotlib.pyplot as plt
import seaborn as sns
sns.set()

def get_nested(item):
    cells = outer.cells[item]

    act = [cells[t] for t in range(50)]
    expect = []

    for t0 in range(0, 6):
        expect_t0 = [np.nan] * 50
        for t in range(0, 50):
            if t < t0:
                expect_t0[t] = np.nan
            else:
                cells = outer.InnerProjection[t0].cells[item]
                expect_t0[t] = cells[t]

        expect.append(expect_t0)

    return act, expect


def mask_act(act, t0):
    masked_act = act.copy()
    for t, val in enumerate(masked_act):
        if t > t0:
            masked_act[t] = np.nan
    return masked_act


def draw_single_ncf(ncf, ax, ls):
    ax.plot(ncf, marker='o', linestyle=ls)
    ax.set_xlim(right=10, left=-1)


def draw_graph_column(item):

    act, expect = get_nested(item)

    nrows = len(expect)
    fg, axs = plt.subplots(nrows=nrows, sharex=True, sharey=True)
    for t0, ax in enumerate(axs):
        draw_single_ncf(expect[t0], ax, ':')
        draw_single_ncf(mask_act(act, t0), ax, '-')


def draw_graph_pair(*items):

    ncols = len(items)
    pairs = [get_nested(item) for item in items]
    nrows = len(pairs[0][1])

    fg, axs = plt.subplots(nrows=nrows, ncols=ncols, sharex=True)

    for col in range(ncols):
        axs[0][col].set_title(items[col])
        for t0 in range(nrows):
            ax = axs[t0][col]
            act, expect = pairs[col]
            draw_single_ncf(expect[t0], ax, ':')
            draw_single_ncf(mask_act(act, t0), ax, '-')

# %% Draw graphs
if __name__ == '__main__':
    draw_graph_pair('nop_Surrender', 'nop_EoP')
Total running time of the script: ( 0 minutes 22.215 seconds)