Note
Click here to download the full example code
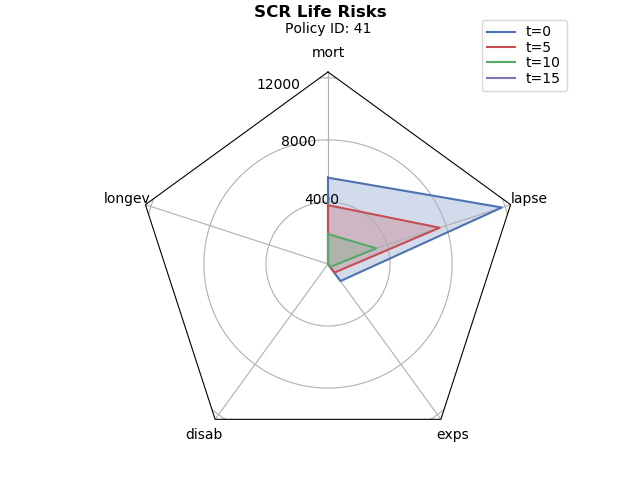
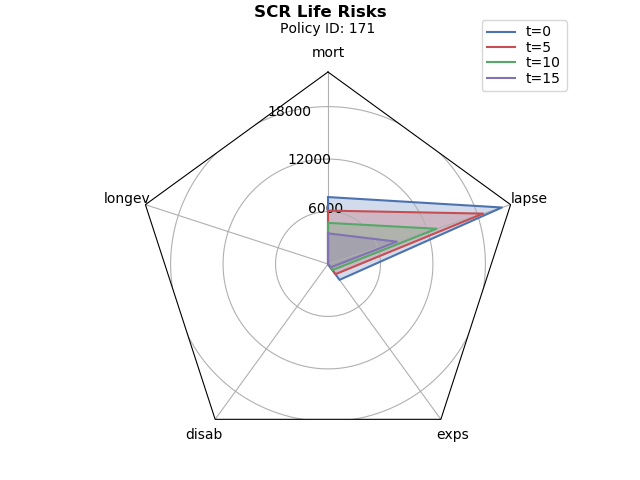
solvency2 Life SCR radar chart
This script draws radar charts for selected policies. Each spoke of the radar chart represents a sub risk of SCR life risks, and the sizes of the sub risks by duration are drawn in the radar chart.
Out:
Started loading data from 'input.xlsx'.
Loading PolicyData...Done. (0.49secs)
Loading MortalityTables...Done. (0.29secs)
Loading ProductSpec...Done. (0.26secs)
Loading OtherParam1...Done. (0.23secs)
Loading OtherParams2...Done. (0.23secs)
Loading Assumption...Done. (0.34secs)
Loading AssumptionTables...Done. (0.29secs)
Loading Scenarios...Done. (0.59secs)
Input space and its sub spaces are saved in '[project name].mx'.
You can load input data from the saved file instead of 'input.xlsx'
by passing 'load_saved=True' to simplelife.build function.
import pandas as pd
from draw_charts_radar import draw_radar

try:
    import solvency2.solvency2 as solvency2
except ImportError:
    import solvency2

model = solvency2.build()
scr = model.SCR_life
risks = ('mort', 'longev', 'disab', 'exps', 'lapse')
scenid = 1


def draw(polid):

    data = {}
    for t in range(0, 20, 5):
        data['t=' + str(t)] = scr[t, polid, scenid].Life.to_series(risks)

    draw_radar(pd.DataFrame(data),
               ax_title='Policy ID: ' + str(polid),
               fig_title='SCR Life Risks')

for i in (41, 171):
    draw(i)
Total running time of the script: ( 0 minutes 9.657 seconds)