Note
Click here to download the full example code
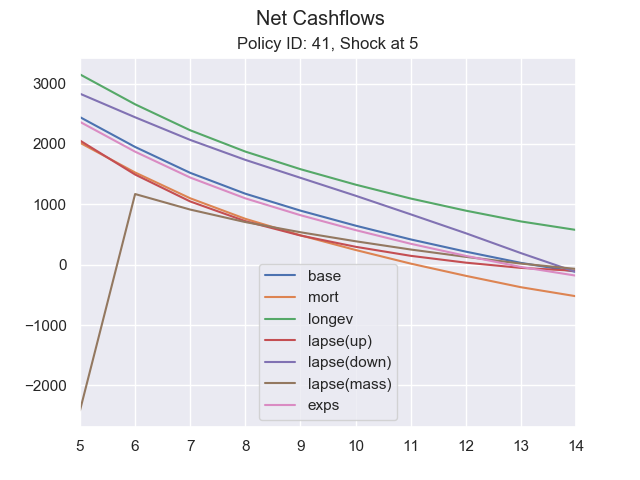
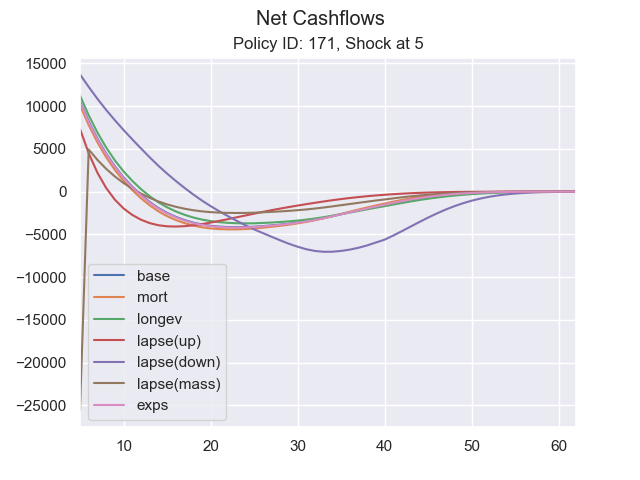
solvency2 cashflows
Net liability cashflows by SCR shock scenarios for selected policies
Out:
Started loading data from 'input.xlsx'.
Loading PolicyData...Done. (0.51secs)
Loading MortalityTables...Done. (0.28secs)
Loading ProductSpec...Done. (0.26secs)
Loading OtherParam1...Done. (0.23secs)
Loading OtherParams2...Done. (0.23secs)
Loading Assumption...Done. (0.26secs)
Loading AssumptionTables...Done. (0.25secs)
Loading Scenarios...Done. (0.27secs)
Input space and its sub spaces are saved in '[project name].mx'.
You can load input data from the saved file instead of 'input.xlsx'
by passing 'load_saved=True' to simplelife.build function.
import pandas as pd
import matplotlib.pyplot as plt
import seaborn as sns
sns.set()

try:
    import solvency2.solvency2 as solvency2
except ImportError:
    import solvency2

model = solvency2.build()


def draw(polid, t0):

    fig, ax = plt.subplots()
    fig.suptitle('Net Cashflows')

    title = 'Policy ID: ' + str(polid) + ', Shock at ' + str(t0)

    data = {}
    for risk, shock in (('base', None),
                        ('mort', None),
                        ('longev', None),
                        ('lapse', 'up'),
                        ('lapse', 'down'),
                        ('lapse', 'mass'),
                        ('exps', None)):

        proj = model.SCR_life[t0, polid].Projection(risk, shock)
        last_t = proj.last_t()
        label = risk + ('(' + shock + ')' if shock else '')
        data[label] = [proj.NetInsurCF[t] for t in range(t0, last_t)]

    return pd.DataFrame(
        data, index=range(t0, last_t)).plot(
        ax=ax, kind='line', title=title)


for polid, t0 in [(41, 5), (171, 5)]:
    draw(polid, t0)
Total running time of the script: ( 0 minutes 6.744 seconds)