Note
Click here to download the full example code
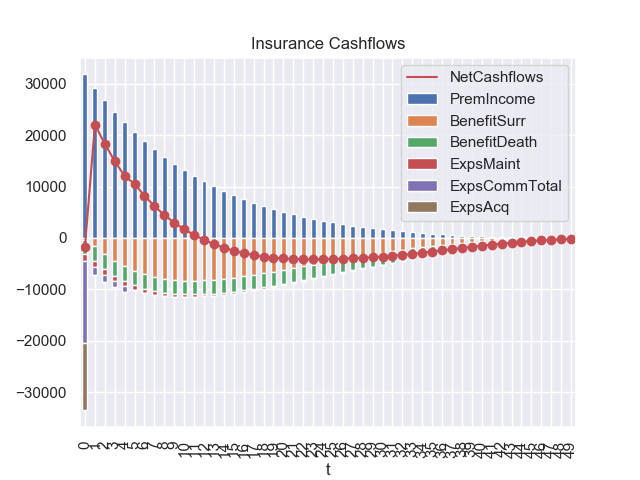
simplelife cashflow
Draw a graph of liability cashflows of a simple whole life policy
Run this sample now!
![]()
Out:
Started loading data from 'input.xlsx'.
Loading PolicyData...Done. (0.59secs)
Loading MortalityTables...Done. (0.28secs)
Loading ProductSpec...Done. (0.26secs)
Loading OtherParam1...Done. (0.23secs)
Loading OtherParams2...Done. (0.35secs)
Loading Assumption...Done. (0.26secs)
Loading AssumptionTables...Done. (0.24secs)
Loading Scenarios...Done. (0.27secs)
Input space and its sub spaces are saved in '[project name].mx'.
You can load input data from the saved file instead of 'input.xlsx'
by passing 'load_saved=True' to simplelife.build function.
import pandas as pd
import modelx as mx

import seaborn as sns
sns.set()

try:
    import simplelife.simplelife as simplelife
except ImportError:
    import simplelife


polid = 171
proj = simplelife.build().Projection[polid]

# Draw NetCashflows Graph
data = {'NetCashflows': [proj.NetInsurCF[t] for t in range(50)]}
ax = pd.DataFrame(data).plot.line(marker='o', color='r')

# Draw componets of net cashflows

vars = ['PremIncome',
        'BenefitSurr',
        'BenefitDeath',
        'ExpsMaint',
        'ExpsCommTotal',
        'ExpsAcq']

df = proj.cells[vars].to_frame(range(50))

df[vars[1:]] = df[vars[1:]].mul(-1)   # Change outflows to negatives
df.plot(kind='bar', stacked=True, ax=ax, title='Insurance Cashflows')
Total running time of the script: ( 0 minutes 4.000 seconds)