Note
Click here to download the full example code
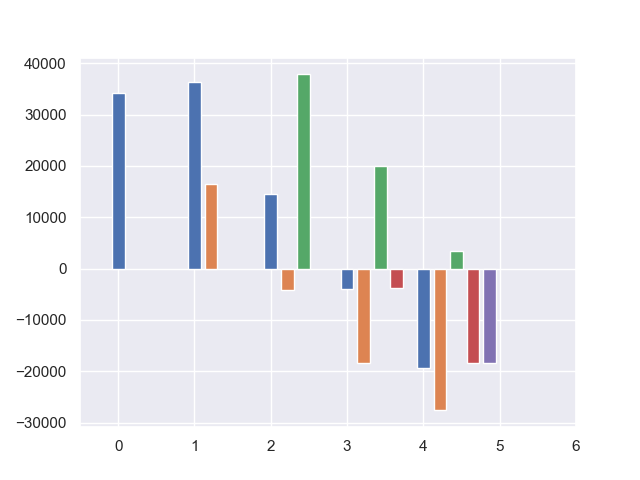
nestedlife cashflow
Draw a graph of present value of cashflow
Out:
Started loading data from 'input.xlsx'.
Loading PolicyData...Done. (0.50secs)
Loading MortalityTables...Done. (0.28secs)
Loading ProductSpec...Done. (0.40secs)
Loading OtherParam1...Done. (0.23secs)
Loading OtherParams2...Done. (0.23secs)
Loading Assumption...Done. (0.26secs)
Loading AssumptionTables...Done. (0.25secs)
Loading Scenarios...Done. (0.27secs)
Input space and its sub spaces are saved in '[project name].mx'.
You can load input data from the saved file instead of 'input.xlsx'
by passing 'load_saved=True' to simplelife.build function.
import modelx as mx

try:
    import nestedlife.nestedlife as nestedlife
except ImportError:
    import nestedlife

model = nestedlife.build()

# Policy point ID and aliases
polid = 171
outer = model.OuterProj[polid]
inner = outer.InnerProj

# Code block for overwiting the defaut model

def SurrRateMult(t):
    if t == 0:
        return 1
    else:
        return SurrRateMult(t-1)


def PolsSurr(t):
    """Number of policies: Surrender"""
    return PolsIF_Beg1(t) * asmp.SurrRate(t) * SurrRateMult(t)


def PolsIF_End_inner(t):
    """Number of policies: End of period"""
    if t == t0:
        return outer.PolsIF_End(t)
    else:
        return PolsIF_Beg1(t-1) - PolsDeath(t-1) - PolsSurr(t-1)


model.BaseProj.new_cells(formula=SurrRateMult)
model.BaseProj.PolsSurr.set_formula(PolsSurr)
model.OuterProj.InnerProj.PolsIF_End.set_formula(PolsIF_End_inner)

outer.SurrRateMult[1] = 2
outer.SurrRateMult[2] = 0.5
outer.SurrRateMult[3] = 1

inner[1].SurrRateMult[1] = 2
inner[2].SurrRateMult[2] = 0.5
inner[3].SurrRateMult[3] = 1

# Code block for PV graph

import numpy as np
import matplotlib.pyplot as plt
import seaborn as sns
sns.set()


def draw_bars(item):

    term = 5

    expect = []
    for t0 in range(term):
        expect_t0 = [np.nan] * term
        for t in range(t0, term):
            cells = outer.InnerProj[t0].cells[item]
            expect_t0[t] = cells[t]

        expect.append(expect_t0)

    fg, ax = plt.subplots()
    ax.set_xlim(left=-0.5, right=term + 1)

    for t0 in range(term):
        draw_single_bar(expect[t0], ax, t0)


def draw_single_bar(data, ax, t0):

    size = len(data)
    width = 1/ (size + 1)
    ax.bar(np.arange(size) + t0 * (width + 0.05), data, width)


# PV Test
if __name__ == '__main__':
    draw_bars('PV_NetCashflow')
Total running time of the script: ( 0 minutes 4.177 seconds)