IFRS17 CSM Waterfall Chart Notebook
To run this notebook and get all the outputs below, Go to the Cell menu above, and then click Run All.
About this notebook
This noteook demonstrates the usage of ifrs17sim project in lifelib, by building and running a model and drawing a waterfall graph of CSM amortization on a single modelpoint.
Warning:
The primary purpose of this model is to showcase the capability of lifelib and its base system modelx, and less attention has been paid to the accuracy of the model or the compliance with the accounting standards. At very least, following items are identified as over-simplification or lack of implementation.
The timing of cashflows is either the beginning or end of each step.
All expenses are included in insurance cashflows.
Loss component logic is not yet incorporated, so
CSM_Unflooredcan be negative.Coverage unit is set to sum assured
Amortization of acquisition cash flows is not yet implemented.
All insurance cashflows are considered non-market sensitive, i.e. no TVOG is considered.
Risk adjustment is not yet modeled.
How to use Jupyter Notebook
Jupter notebook enables you to run a Python script piece by piece. You can run each piece of code (called a “cell”) by putting the cursor in the cell and pressing Shift + Enter, and get the output right below the input code of the cell.
If you want to learn more about Jupyter Notebook, this tutorial will help you. There are also plenty of other resources on the internet as Jupyter Notebook is quite popular.
The entire script
Below is the entire script of this example. The enire scipt is broken down to several parts in differenc cells, and each part is explained below. The pieces of code in cells below are executable one after another from the top.
%matplotlib notebook
import collections
import pandas as pd
from draw_charts import draw_waterfall
import ifrs17sim

model = ifrs17sim.build()

proj = model.OuterProj[1]
proj.CSM_Unfloored(15)

df = proj.cells['CSM_Unfloored',
                'IntAccrCSM',
                'AdjCSM_FlufCF',
                'TransServices'].to_frame(range(15))

df['TransServices'] = -1 * df['TransServices']

draw_waterfall(df)
Initial set-up
The first line %matplotlib notebook, is for specifying drawing mode.
The next few lines are import statements, by which functions defined in other modules become avaialbe in this script.
ifrs17sim and draw_charts modules are in the project directory
of this project. To see what fiels are in the project directory, select
Open from the File menu in the tool bar above.
Building the model
The next line is to create a model from build function defined in
ifrs17sim module which has just been imported.
By supplying True to load_saved parameter of the build
function, the input data is read from ifrs17sim.mx, the ‘pickled’
file to save loading time. To read input from input.xlsm, call
build with load_saved=False or without any parameter because
False is the default value of load_saved.
If you run this code multiple time, the previous model is renamed to
ifrs17sim_BAK*, and a new model is created and returned as
model.
In [2]:
model = ifrs17sim.build(load_saved=True)
To see what space is inside model, execute model.spaces in an
empty cell.
model.spaces
Calculating CSM
In model thre is a space called OuterProj and other spaces.
OuterProj is parametrized by Policy ID, i.e. each of the spaces with
parameters corresponds to a projection of one policy. For example,
model.OuterProj[1] return the projection of policy ID 1,
model.OuterProj[171] return the projection of policy ID 171.
The first line below sets proj as a shorthand for the projection of
Policy ID 1. To see what cells are in proj, execute proj.cells
in an empty cell.
proj.cells
You can change the sample policy to output by supplying some other ID.
In [3]:
proj = model.OuterProj[1]
Exporting values into DataFrame
The code below is to construct a DataFrame object for drawing the waterfall chart, from the cells that make up bars in the waterfall chart.
The last line is to change the sign of TransServices values, as we
want to draw them as negative values that push down the CSM balance.
In [4]:
df = proj.cells['CSM_Unfloored',
                'IntAccrCSM',
                'AdjCSM_FlufCF',
                'TransServices'].to_frame(range(15))

df['TransServices'] = -1 * df['TransServices']
Tha table below show the DataFrame values.
In [5]:
df
Out[5]:
| CSM_Unfloored | IntAccrCSM | AdjCSM_FlufCF | TransServices | |
|---|---|---|---|---|
| t | ||||
| 0 | 8954.018303 | 134.310275 | 0.0 | -1107.579599 |
| 1 | 7980.748979 | 119.711235 | 0.0 | -1018.376245 |
| 2 | 7082.083968 | 106.231260 | 0.0 | -936.321598 |
| 3 | 6251.993630 | 93.779904 | 0.0 | -860.839096 |
| 4 | 5484.934439 | 82.274017 | 0.0 | -791.417588 |
| 5 | 4775.790867 | 71.636863 | 0.0 | -727.577888 |
| 6 | 4119.849842 | 61.797748 | 0.0 | -668.867446 |
| 7 | 3512.780144 | 52.691702 | 0.0 | -614.866432 |
| 8 | 2950.605414 | 44.259081 | 0.0 | -565.186454 |
| 9 | 2429.678041 | 36.445171 | 0.0 | -519.477000 |
| 10 | 1946.646212 | 29.199693 | 0.0 | -477.424298 |
| 11 | 1498.421607 | 22.476324 | 0.0 | -438.739084 |
| 12 | 1082.158847 | 16.232383 | 0.0 | -403.151641 |
| 13 | 695.239589 | 10.428594 | 0.0 | -370.411293 |
| 14 | 335.256889 | 5.028853 | 0.0 | -340.285743 |
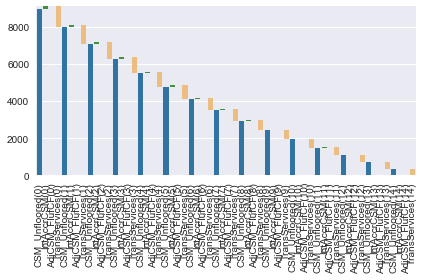
Draw waterfall chart
The last line is to draw the waterfall graph. The function to draw the
graph was imported from the separate module draw_charts in this
project directory, and was imported at the first part of this script.
In [6]:
draw_waterfall(df)
Out[6]:
<matplotlib.axes._subplots.AxesSubplot at 0x1483e9b0>