Note
Click here to download the full example code
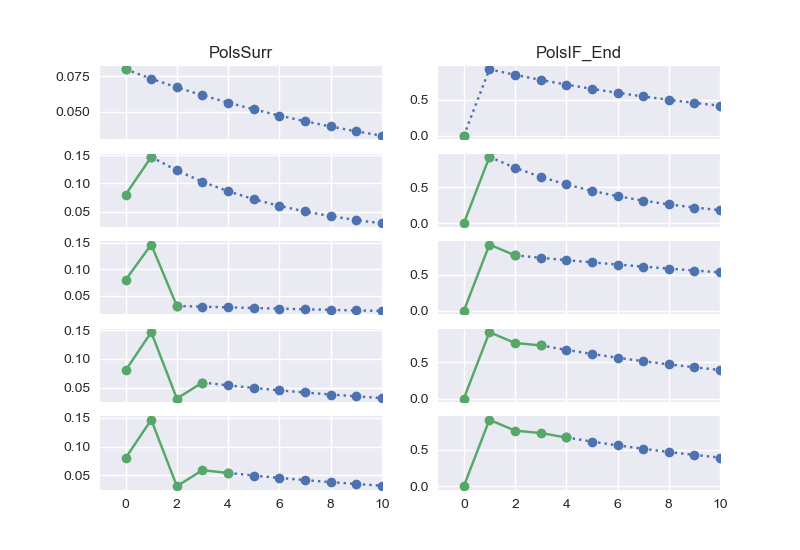
Actual vs Estimated
Lapse assumption changes based on previous year experience.
import modelx as mx

try:
    import nestedlife.nestedlife as nestedlife
except ImportError:
    import nestedlife

model = nestedlife.build(True)

# Policy point ID and aliases
polid = 171
outer = model.OuterProj[polid]
inner = outer.InnerProj

# %% Code block for overriding the default model

def SurrRateMult(t):
    if t == 0:
        return 1
    else:
        return SurrRateMult(t - 1)


def PolsSurr(t):
    """Number of policies: Surrender"""
    return PolsIF_Beg1(t) * asmp.SurrRate(t) * SurrRateMult(t)


def PolsIF_End_inner(t):
    """Number of policies: End of period"""
    if t == t0:
        return outer.PolsIF_End(t)
    else:
        return PolsIF_Beg1(t - 1) - PolsDeath(t - 1) - PolsSurr(t - 1)


model.BaseProjection.new_cells(formula=SurrRateMult)
model.BaseProjection.new_cells(formula=PolsSurr)
inner.new_cells(name='PolsIF_End', formula=PolsIF_End_inner)

outer.SurrRateMult[1] = 2
outer.SurrRateMult[2] = 0.5
outer.SurrRateMult[3] = 1

inner[1].SurrRateMult[1] = 2
inner[2].SurrRateMult[2] = 0.5
inner[3].SurrRateMult[3] = 1

# %% Code block for drawing graphs

import numpy as np
import matplotlib.pyplot as plt
import seaborn as sns
sns.set()


def get_est(inner, item, t0, t_max):
    """Get estimated values for ``item`` (nan for t < t0)."""
    cells = inner[t0].cells[item]
    return [cells[t] if t >= t0 else np.nan
            for t in range(t_max)]


def get_act(outer, item, t0, t_max):
    """Get actual values for ``item`` (nan for t > t0)."""
    cells = outer.cells[item]
    return [cells[t] if t <= t0 else np.nan
            for t in range(t_max)]


def get_actest(outer, inner, item, t0_max, t_max):
    """Get a pair of actual and estimated values at t0."""
    return (get_act(outer, item, t0_max, t_max),
            get_est(inner, item, t0_max, t_max))


def draw_single_ncf(values, ax, xlim, ls):
    """Draw a plotted line of values."""
    ax.plot(values, marker='o', linestyle=ls)
    ax.set_xlim(right=xlim, left=-1)


def draw_actest_pairs(*items):
    """Draw pairs of line graphs."""
    ncols = len(items)
    nrows = 5
    t_max = 10

    _, axs = plt.subplots(nrows=nrows, ncols=ncols, sharex=True)

    for col, item in enumerate(items):
        axs[0][col].set_title(items[col])
        for t0 in range(nrows):
            ax = axs[t0][col]
            act, est = get_actest(outer, inner, item, t0, t_max + 1)
            draw_single_ncf(est, ax, t_max, ':')
            draw_single_ncf(act, ax, t_max, '-')


draw_actest_pairs('PolsSurr', 'PolsIF_End')
plt.show()
Total running time of the script: ( 0 minutes 2.290 seconds)