Note
Click here to download the full example code
IFRS waterfall chart#
The script draws multiple waterfall charts, each of which depict sources of changes in balances related to IFRS17. The script is broken down into pieces of code, and explained in a Jupyter notebook, IFRS17 Simulation (Baseline).
The live version of the notebook is available online.
See also
The
ifrs17simlibrary
from draw_charts import draw_waterfall, get_waterfalldata
import modelx as mx
import seaborn as sns
sns.set_theme(style="darkgrid")

model = mx.read_model("model")
proj = model.OuterProj[1]

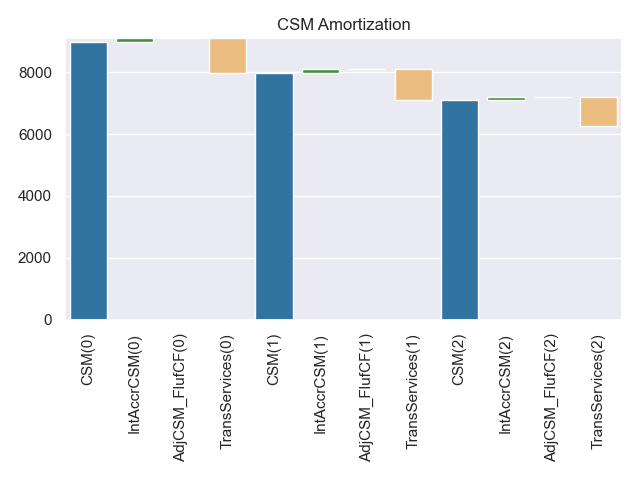
# CSM Amortization

csmrf = get_waterfalldata(
            proj,
            items=['CSM',
                   'IntAccrCSM',
                   'AdjCSM_FlufCF',
                   'TransServices'],
            length=3,
            reverseitems=['TransServices'])

draw_waterfall(csmrf, title='CSM Amortization')

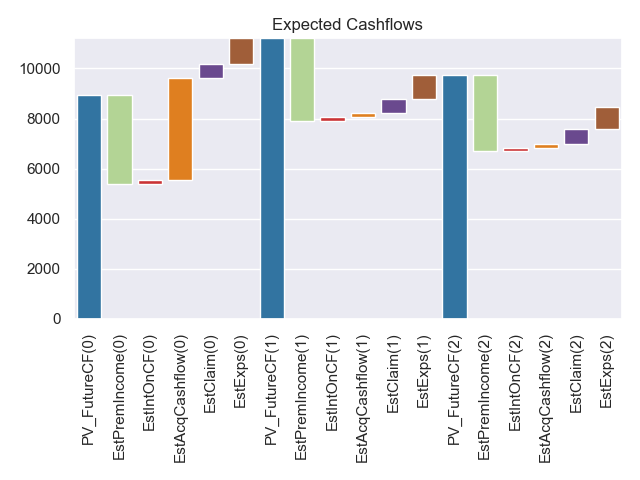
# Expected Cashflow Rollforwad

estcf = get_waterfalldata(
            proj,
            items=['PV_FutureCF',
                   'EstPremIncome',
                   'EstIntOnCF',
                   'EstAcqCashflow',
                   'EstClaim',
                   'EstExps'],
            length=3,
            reverseitems=['EstPremIncome'])

draw_waterfall(estcf, title='Expected Cashflows')

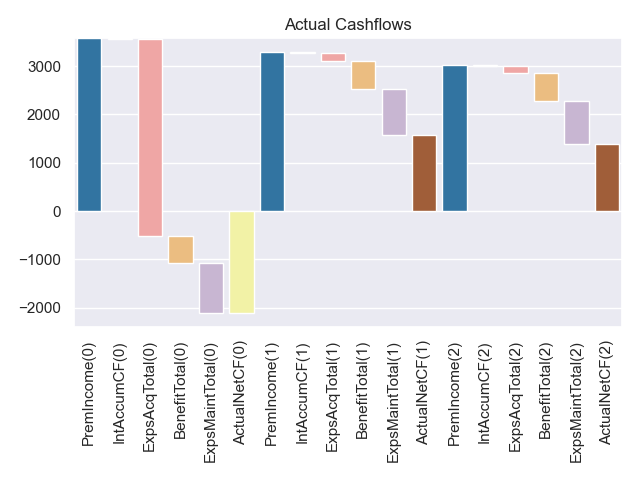
# Actual Cashflow Rollforward

actcf = get_waterfalldata(
            proj,
            items=['PremIncome',
                   'IntAccumCF',
                   'ExpsAcqTotal',
                   'BenefitTotal',
                   'ExpsMaintTotal',
                   'ActualNetCF'],
            length=3,
            reverseitems=['ExpsAcqTotal',
                          'BenefitTotal',
                          'ExpsMaintTotal'])

draw_waterfall(actcf, stocks=[0, 5], title='Actual Cashflows')

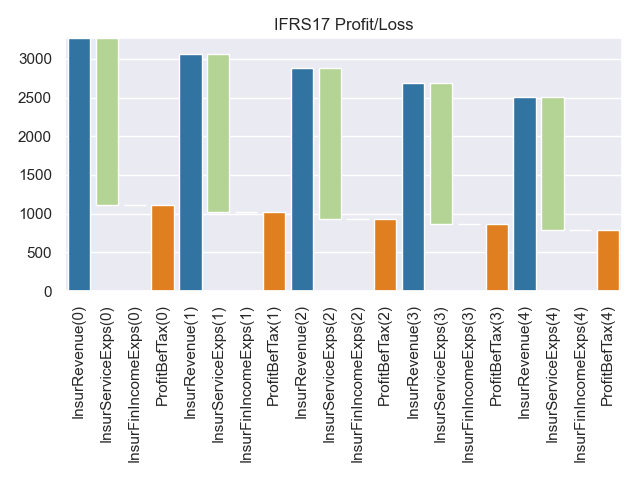
# IFRS17 Financial Performance

ifrspl = get_waterfalldata(
            proj,
            items=['InsurRevenue',
                   'InsurServiceExps',
                   'InsurFinIncomeExps',
                   'ProfitBefTax'],
            length=5,
            reverseitems=['InsurServiceExps'])

draw_waterfall(ifrspl, stocks=[0, 3], title='IFRS17 Profit/Loss')
Total running time of the script: ( 0 minutes 2.243 seconds)


