Note
Click here to download the full example code
fastlife present values of net cashflows
import matplotlib.pyplot as plt
import seaborn as sns
sns.set()
import modelx as mx

proj = mx.read_model("model").Projection
pols = proj.Policy.PolicyData()


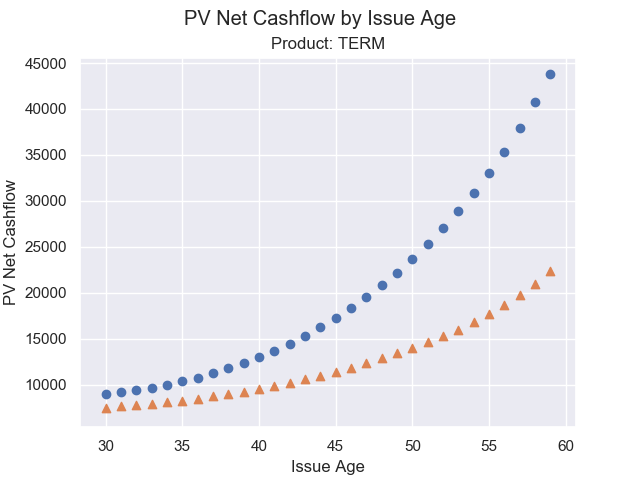
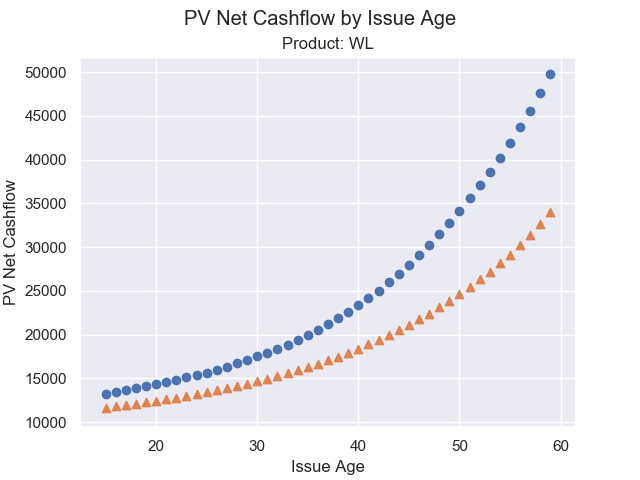
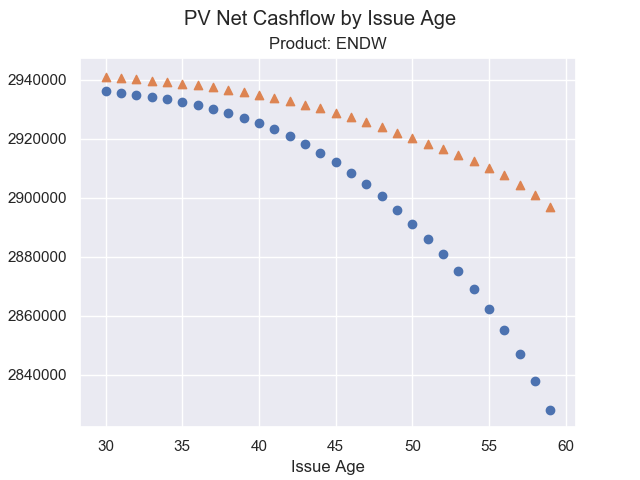
for prod in ["TERM", "WL", "ENDW"]:

    fig, ax = plt.subplots()
    fig.suptitle('PV Net Cashflow by Issue Age')
    ax.set_title('Product: ' + prod)
    title = 'Product: ' + prod
    ax.set_xlabel('Issue Age')
    ax.set_ylabel('PV Net Cashflow')

    for sex, marker in zip(["M", "F"], ["o", "^"]):
        filter = (pols.Product == prod) & (
                pols.Sex == sex) & (pols.IssueAge < 60)
        ages = proj.Policy.IssueAge().loc[filter]
        pvcfs = proj.PV_NetCashflow(0).loc[filter]
        ax.scatter(ages, pvcfs, marker=marker)


plt.show()
Total running time of the script: ( 0 minutes 12.575 seconds)


