Note
Click here to download the full example code
ifrs17sim IFRS waterfall chart
The script draws multiple waterfall charts, each of which depict sources of changes in balances related to IFRS17. The script is broken down into pieces of code, and explained in a Jupyter notebook, IFRS17 waterfall chart notebook.
The live version of the notebook is available online.
Launch this notebook online!
![]()
import pandas as pd
import collections
import matplotlib.pyplot as plt
from draw_charts import draw_waterfall
try:
import ifrs17sim.ifrs17sim as ifrs17sim
except ImportError:
import ifrs17sim
model = ifrs17sim.build(True)
proj = model.OuterProjection[1]
proj.CSM_Unfloored(15)
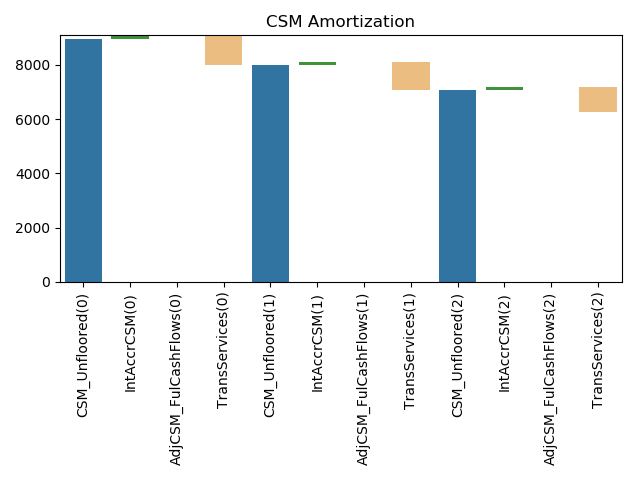
data = collections.OrderedDict()
for cells in ['CSM_Unfloored',
'IntAccrCSM',
'AdjCSM_FulCashFlows',
'TransServices']:
data[cells] = [proj.cells[cells](t) for t in range(3)]
df = pd.DataFrame(data)
df['TransServices'] = -1 * df['TransServices']
draw_waterfall(df, title='CSM Amortization')
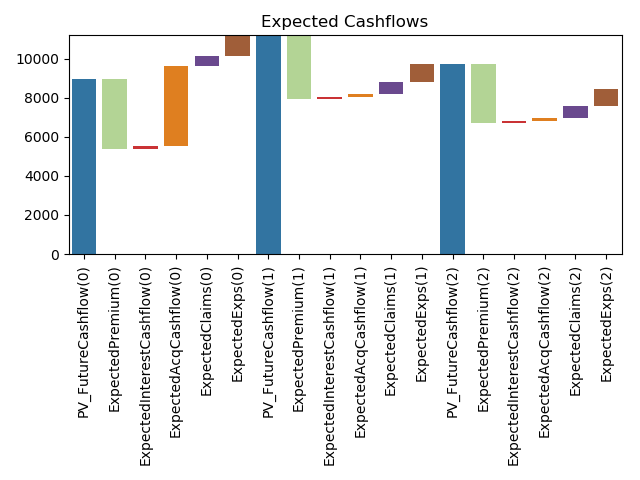
# %% Expected Cashflow Rollforwad
data.clear()
for cells in ['PV_FutureCashflow',
'ExpectedPremium',
'ExpectedInterestCashflow',
'ExpectedAcqCashflow',
'ExpectedClaims',
'ExpectedExps']:
data[cells] = [proj.cells[cells](t) for t in range(3)]
estcf = pd.DataFrame(data)
for inflow in ['ExpectedPremium']:
estcf[inflow] = -1 * estcf[inflow]
plt.figure()
draw_waterfall(estcf, title='Expected Cashflows')
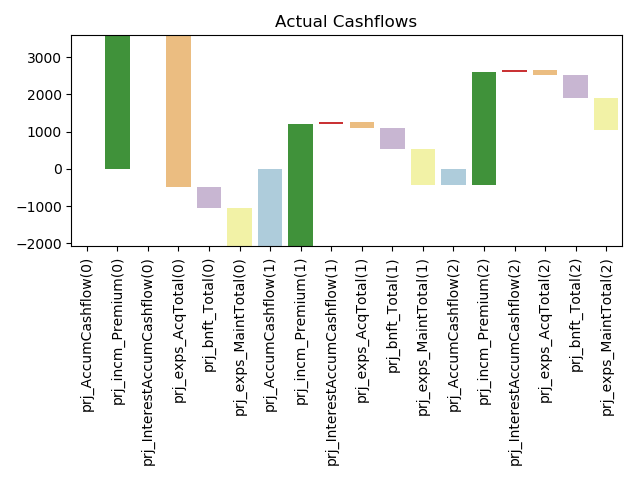
# %% Actual Cashflow Rollforward
data.clear()
for cells in ['prj_AccumCashflow',
'prj_incm_Premium',
'prj_InterestAccumCashflow',
'prj_exps_AcqTotal',
'prj_bnft_Total',
'prj_exps_MaintTotal']:
data[cells] = [proj.cells[cells](t) for t in range(3)]
actcf = pd.DataFrame(data)
for outflow in ['prj_exps_AcqTotal',
'prj_bnft_Total',
'prj_exps_MaintTotal']:
actcf[outflow] = -1 * actcf[outflow]
plt.figure()
draw_waterfall(actcf, title='Actual Cashflows')
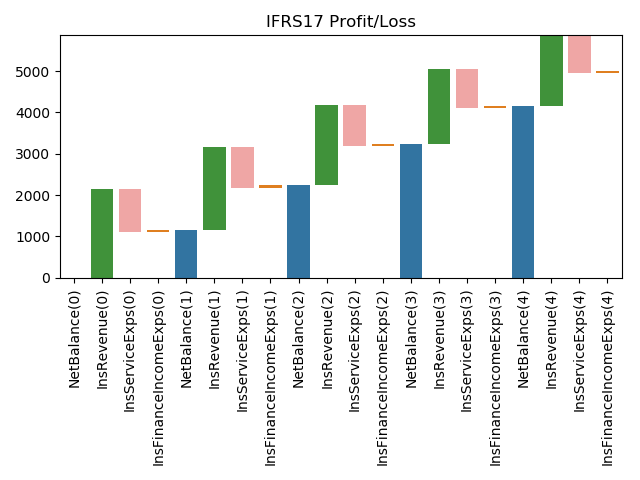
# %% IFRS17 Financial Performance
data.clear()
for cells in ['NetBalance',
'InsRevenue',
'InsServiceExps',
'InsFinanceIncomeExps']:
data[cells] = [proj.cells[cells](t) for t in range(5)]
ifrspl = pd.DataFrame(data)
for pl in ['InsServiceExps']:
ifrspl[pl] = -1 * ifrspl[pl]
plt.figure()
draw_waterfall(ifrspl, title='IFRS17 Profit/Loss')
Total running time of the script: ( 0 minutes 4.297 seconds)