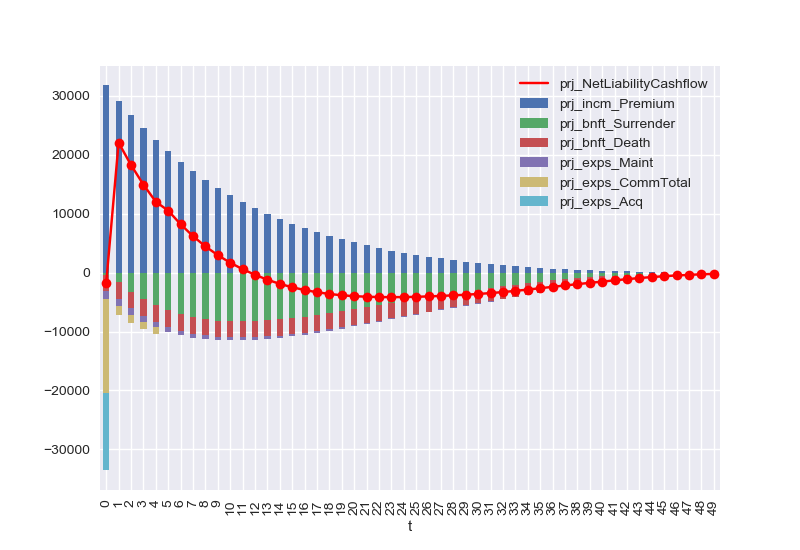
simplelife cashflow
Draw a graph of liability cashflows of a simple whole life policy
Run this sample now! ![]()
import modelx as mx

try:
    import simplelife.simplelife as simplelife
except ImportError:
    import simplelife

polid = 171
proj = simplelife.build().Projection[polid]

vars = ['prj_incm_Premium',
        'prj_bnft_Surrender',
        'prj_bnft_Death',
        'prj_exps_Maint',
        'prj_exps_CommTotal',
        'prj_exps_Acq']

for cells in vars:
    list(proj.cells[cells](t) for t in range(50))

list(proj.prj_NetLiabilityCashflow[t] for t in range(50))


# %% Code block for drawing graph
import seaborn as sns
sns.set()

def draw_cashflow(proj):

    cfs = proj.frame[vars].sort_index().dropna()
    cfs[vars[1:]] = cfs[vars[1:]].mul(-1)   # Change outflows to negatives

    ncf = proj.prj_NetLiabilityCashflow.frame.sort_index()

    axes = ncf.plot.line(marker='o', color='r')
    cfs.plot(kind='bar', stacked=True, ax=axes)

# %% Main
if __name__ == '__main__':
    draw_cashflow(proj)
Total running time of the script: ( 0 minutes 23.427 seconds)